BUSAD 360 Final Assignment
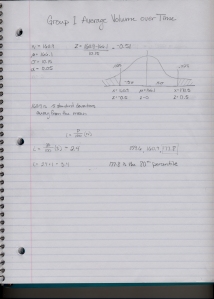
I analyzed urine excretion output. There were four groups in the data: a group that drank water, a group that ate pretzels, a group that drank soda, and a control group. I analyzed the volume, flow rate, total dissolved solids, and the pH of each group for 3 different time periods. I created graphs for the groups’ averages of each independent variable (volume, flow rate, TDS, pH) to show the difference each substance consumed had on the urine. I also calculated the standard deviation and median of each group. I attached a z score chart of group 1’s average volume over time to determine how many standard deviations away the volume of the first urine analysis was to the group mean. I also calculated a percentile range for group 1’s average volume over time just for fun.
After doing this analysis, I learned that the consumption of water had an increase in the volume of urine output, whereas consuming soda and salt had the opposite affect. Fluid rate for group 1 had a significant decrease, group 4 had a minor decrease, and groups 2 and 3 had slight increases. Fluid volume and fluid rate seemed to have no correlation. It was interesting that the total dissolved solids increased in both the pretzel group as well as the control group. There should have been more dissolved solids of group 2 due to the intake of the sodium, but there may have been unknown extenuating circumstances as to why the control group also increased. Group 1 decreased in TDS over time because the urine was more diluted due to the excess water from consumption. The level of pH fluctuated as well within the groups. The urine analysis of group 1 and 2 showed a slightly more basic pH, while group 3 and 4 had a more acidic pH over time. This correlates with the fact about the concentration of urine in that water and sodium are more neutral or basic substances, which contributes to the overall pH of the groups’ urine samples.